2.1 Application layout
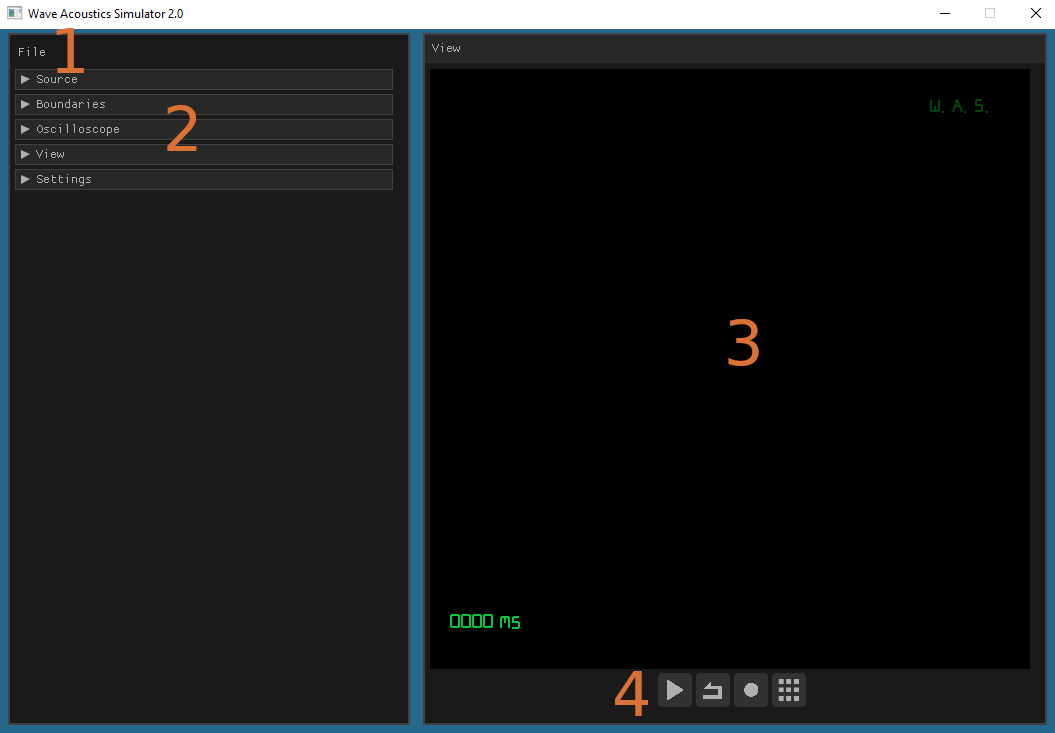
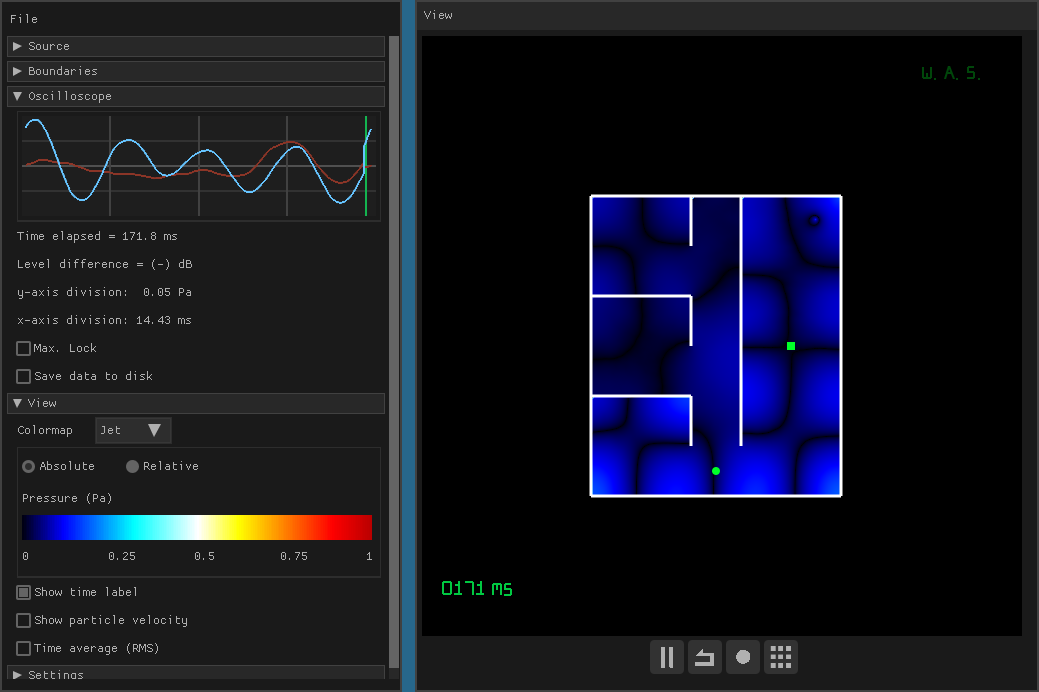
The next figure depicts the Wave Acoustics Simulator GUI (Graphical User Interface). It consists of four main regions:
-
File menu - Here the user can quit the application, load a new simulation or check information about WaveAcoustics itself.
-
Simulation option tabs – The user can set the source and boundary characteristics, view data in real time using a virtual oscilloscope and change graphical and other simulation settings. Each option type is grouped into an expandable tab, listed below. These options are described in greater detail in the subsequent chapters of this documentation.
• Source
• Boundaries
• Oscilloscope
• View
• Settings
-
Main view - Shows the graphical output of wave simulations. By default, the elapsed time is shown in the bottom left corner. A ‘W.A.S.’ watermark is displayed on the top right corner. This watermark is not displayed in the industrial version.
-
Simulation controls - Play/pause, reset, record animation and set snap grid on/off.
2.2 How to setup a basic simulation
2.2.1 Input Sources
Right-click on the main view to create a sinusoidal source (default source):
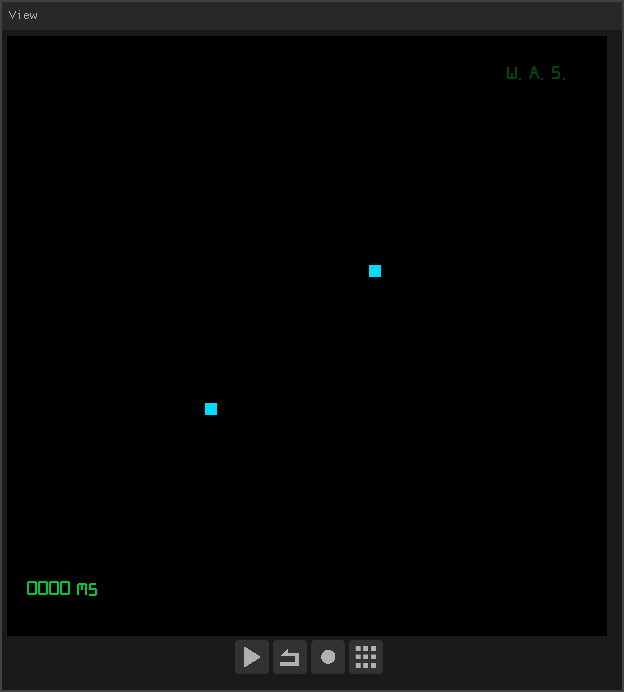
Note that the source positions will be marked with light blue squares. You can then start the simulation or pause it at any time by pressing the ‘play/pause’ button down in the simulation controls:

Note that the source position markers disappear while the simulation is running:
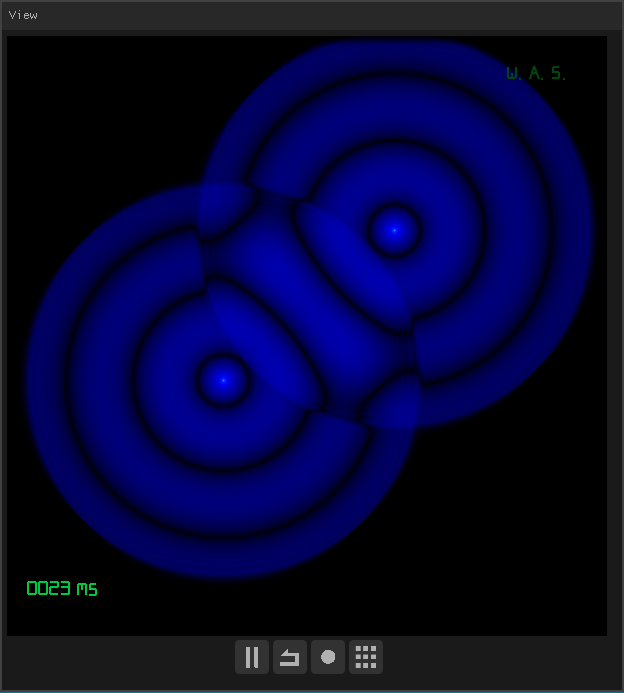
If you wish to edit the characteristics of your source or even input a different type of source, use the expandable ‘Source’ menu, in the simulation option tabs.
2.2.2 Input boundaries
Left-click on the main view. This will enter boundary insertion mode:
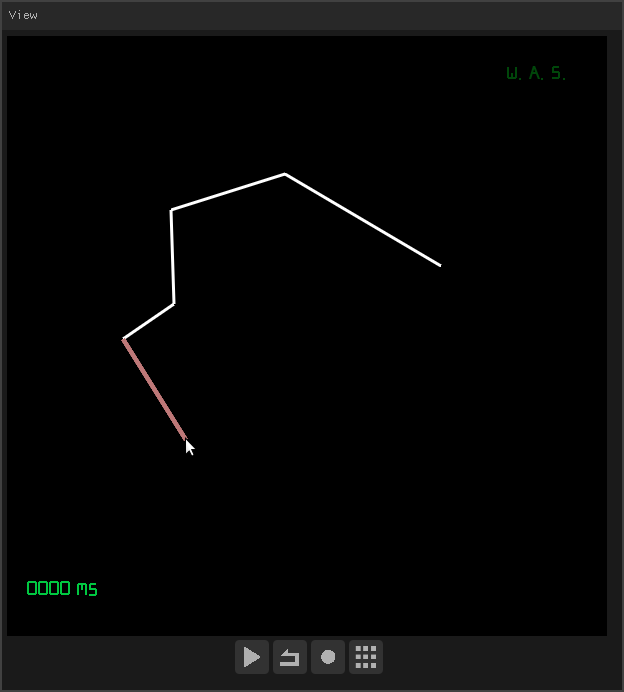
Please note that whilst the boundary position has not been fixed by the user, the boundary will appear pink. Otherwise, it will appear white.
The user must press the ‘ESC’ key in order to exit boundary insertion mode.
2.2.3 Snap grid on/off
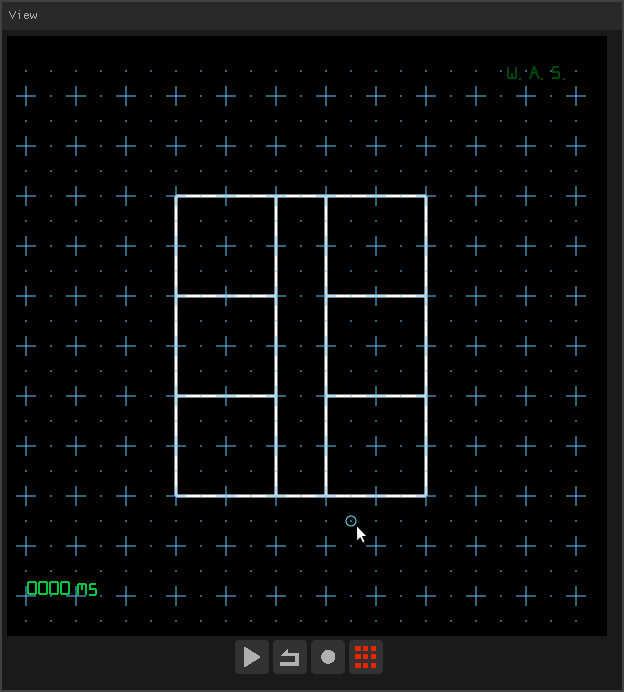
You can toggle the snap grid on/off by clicking the snap button in the simulation controls:

The snap button will turn red and the snap grid will be displayed:
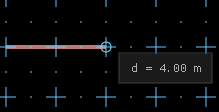
It is worth noting that whilst inserting boundaries (and while the snap grid is enabled) a tooltip appears next to the mouse cursor indicating the corresponding physical distance of the boundary.
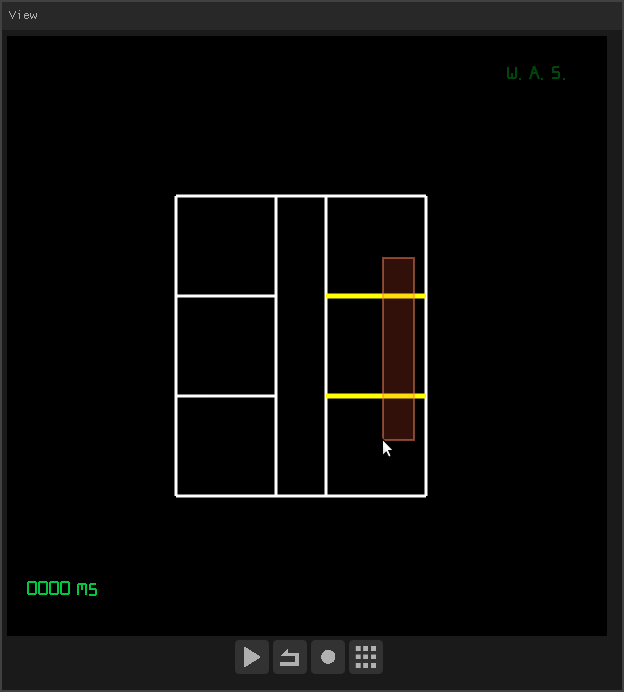
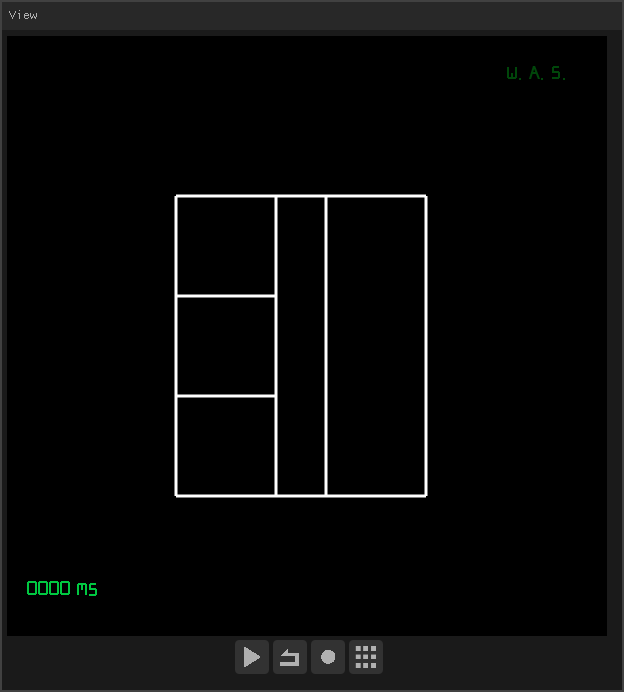
2.2.4 Select/Delete boundaries
2.2.5 Simulation output
The following picture depicts the graphical output of the Wave Acoustics Simulator, where the user defined a sound source, two receiver positions and a set of boundaries:
2.2.6 Saving audio/data
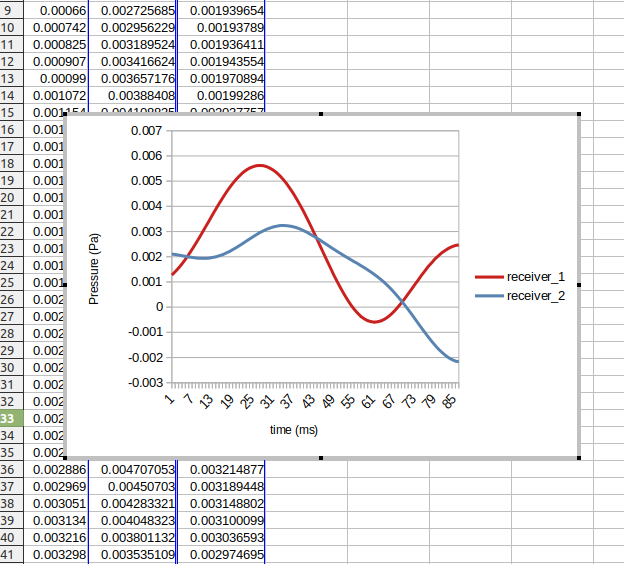
The user should not attempt to open the file ‘data.csv’ while data is being streamed into it. When the user unchecks the option ‘Save data/audio’, the data streaming process ends and a data (.csv) and two audio (.wav) files are created inside the ‘data_output’ folder. On Windows 10, an empty command line window shows up for a few seconds while the audio files are being created:

The resulting file ‘data.csv’ can then be opened by 3rd party software such as a spreadsheet, MATLAB or Python. As an example, the following figure shows the data being opened using a spreadsheet:
For example, the following scene depics a sound source (pulse) and a receiver placed midway between two walls:
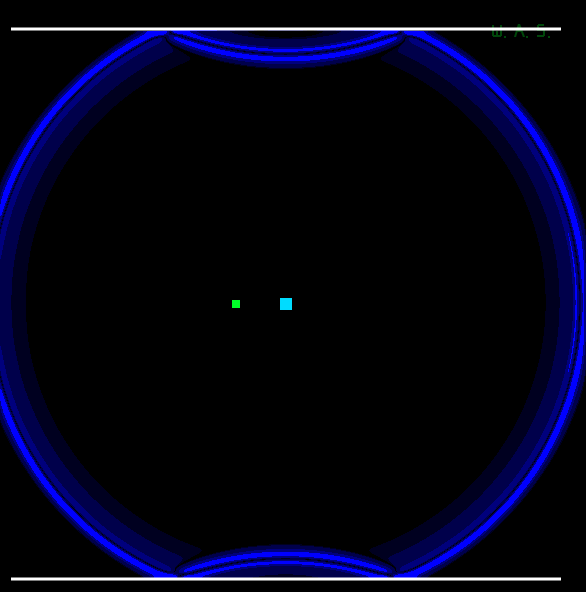
Since the distance between walls is 22m, ‘flutter echoes’ can be clearly heard in the audio:
2.2.7 Reset simulation
To reset to an entirely new simulation, click ‘File -> New’ in the file menu:
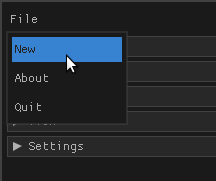

To reset only the receiver data and positions, press the ‘R’ key.
2.2.8 Record animation
Wave Acoustics Simulator offers a way to record an animation of the simulations.

This will trigger the simulation to start playing. The ‘rec’ button will turn red while the recording is ongoing:


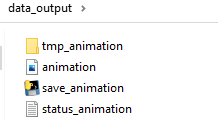
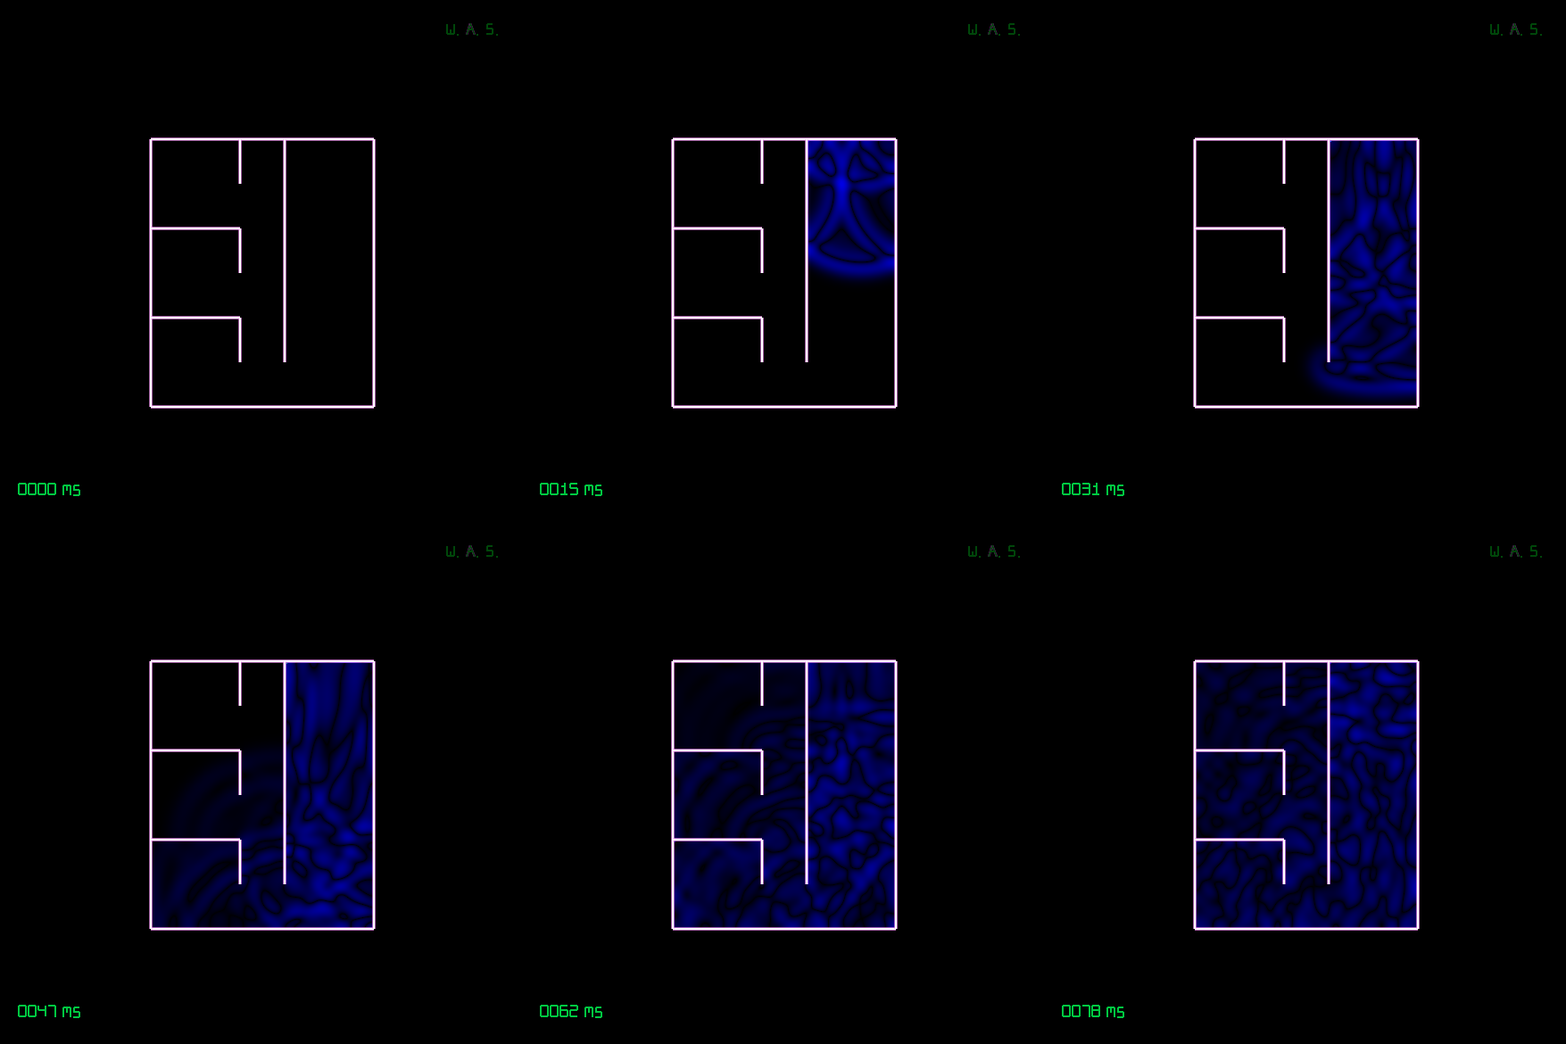
The animation file obtained in our test simulation is shown here:
2.3 Keyboard shortcuts
Several actions on WAS can be performed using the keyboard, as indicated in the following list:
- ‘ESC’ - is used to finish entering boundaries, which become active and will appear white.
- ‘ENTER’ - is used to automatically close the boundaries to their starting point (while in boundary insertion mode).
- ‘SPACE’ - Pause/Unpause the simulation
- ‘DELETE’ - is used to remove selected boundaries from the simulation.
- ‘R’ - Pressing the ‘R’ key resets the receivers position and corresponding data.