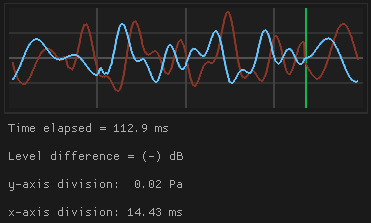
 The user can inspect signals in running time using the ‘Oscilloscope’ tab.
5.1 Analyzing the plot
The 'Oscilloscope' tab contains a plot widget that displays the simulation values at the assigned receiver(s) positions.
The values are updated at runtime by a moving green bar, which wraps around the plotting area.
The plot contains up to two lines, one red - corresponding to the first receiver (green square)- and the other blue - corresponding to the second receiver (green circle).
The two lines are shown overlapped in the same plotting area, to allow for an easier appreciation of phase differences between the receiver signals.

‘Time elapsed’ indicates the value of time elapsed in the simulation.
'Level difference' indicates the sound pressure level difference between the two receivers. By default it shows a (-) value. In order to
display an actual level difference, the receiver positions need to be set and the option 'time average (RMS)' in the 'View' tab must be enabled.
'x and y-axis divisions' indicate the value and corresponding units of the plot divisions, in the x and y-direction respectively.
5.2 Input receiver probes
In order to set the receiver(s) in the simulation, the user should click with the middle mouse button inside the main view area.
It is possible to add up to 2 receivers in a given simulation.
When a receiver is added, a green aquare will appear for the first receiver added and a green circle will appear for the second receiver added:

5.2.1 Reset receiver probes
In order to clear the receiver probes data and position, the user should press the ‘R’ key.
5.3 Max Lock

Similarly to a real world oscilloscope, the ‘Max. lock’ option locks the y-axis scale to the maximum value reached in a given simulation.
5.4 Save data/audio

The user can save the data stored in the receiver(s) to disk in order to allow for post-processing using other software. The output data is written to a 'data.csv' file and is placed inside the folder 'data_output'. If this folder does not exist, it is created in the same location where the executable file is running. In addition, two audio files (.wav - 44,100Hz sampling rate) are also produced when this option is checked. The contents of the files 'data.csv', 'audio_receiver1.wav' and 'audio_receiver2.wav' get overwritten every time data is saved, so it is best to copy these files to a different folder and rename them.