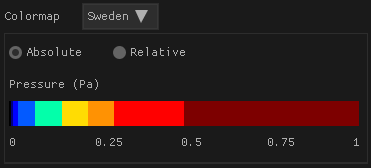
The user can choose different colormaps using the 'Colormap' dropdown menu.
Several colormaps are available. Which one is best depends on the particular aplication
and whether particle velocities are being visualized (colormaps with less contrasting colors might be better suited to visualize particle velocity).

The colormaps currently available are:
    - Amazon
    - Casino
    - Jet
    - Monochrome
    - Sweeden
All colormaps depict linear values of sounds pressure, expressed in Pa. The user is able to toggle between relative and absolute pressure display.
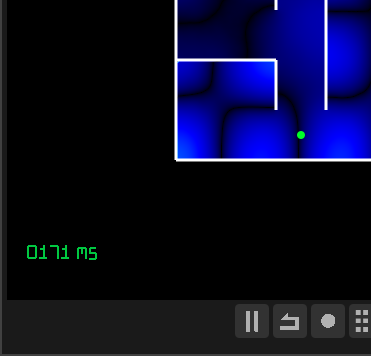
Show time label

Enabling this option will display the time elapsed on the bottom left corner of the main view:

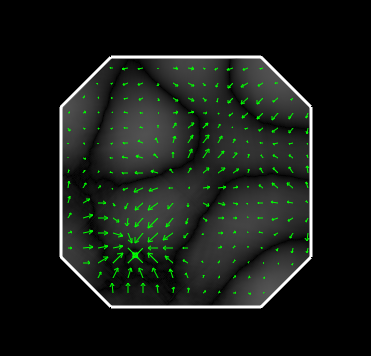
Show particle velocity

Enabling this option will display the sound particle velocity at a number of grid positions.

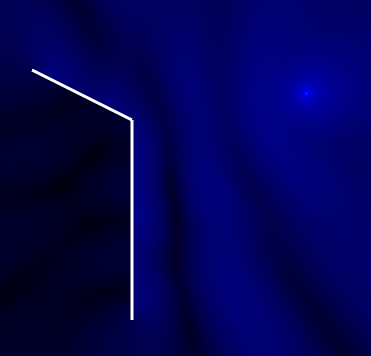
Time average (RMS)

Enabling this option will display the average RMS sound pressure:

Enabling this option will also allow the calculation of sound pressure level differences between two receivers, which is shown in the 'Oscilloscope' tab.